Visualising Budget Data on IATI – Working on a Solution
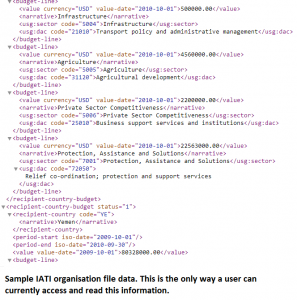
Almost twelve months ago I wrote about how people could use IATI organisation file data to find past, present and future donor budgets, alongside a library of linked strategic documents that help put the data in context. The problem? Despite the data being published by a significant number of major donors, there is no way for anybody to view the information beyond interrogating the raw data in the IATI Registry.
It was for this reason that when an individual contacted me after my original blog, and asked if I could show them how to use this IATI data, the best way I could do was produce this 12 page slide-deck showing them how to read the XML and talk them through it. Needless to say, their interest waned. Was there a data use-case? Yes. Was there a data user? Yes. Was the data used? No.
Moreover, if the data is not visualised then it not only hinders the use of potentially valuable data but also reduces the incentive for publishers to improve the quality of their data. In other words, visualisation is a critical component of showing donors that what they publish, or don’t publish, matters. Equally, not visualising it tells them that this data doesn’t really matter — so why bother?

Publish What You Fund is hoping to be part of the solution. As part of our US Foreign Assistance Project, I’ll be working with our Aid Information Advisor, Andy Lulham (AKA: @andylolz), who will be developing a lightweight simple tool (browser plug-in) to enable users to quickly visualise all organisation’s strategic data on the IATI Registry web pages within the browser.
In other words, once installed, the plug-in will automatically change raw XML into clean, usable, information. Instead of being confronted with a stream of data, the individual will be able to read the following information (where possible) in a user-friendly format as well as quickly access available strategic documents pertaining to individual countries and generate graphs:
- Donor budget by fiscal year
- Donor budget by sector by fiscal year
- Donor budgets by recipient country by fiscal year
- Donor budgets for a recipient country by sector
- Links to donor documents, such as country strategies
For a full list of the features we’re hoping to include, see here. We’re aiming to have this done-and-dusted within the next six weeks, but will be reaching out to people to help us test it in the near future. If you’d like to be involved, whether that is by testing it or just sharing your ideas/expertise, please get in touch!
As part of the US Foreign Assistance project, Publish What You Fund used aid data, including IATI, to assess the potential impact of the proposed US budget cuts. Based on our user experience, we’ll be proposing solutions for how aid can be more transparent going forward.

