• Skip to primary navigation
  • Skip to main content
  • Skip to primary sidebar

Publish What You FundPublish What You Fund

The Global Campaign for Aid and Development Transparency

  • RSS
  • Twitter
  • Vimeo
  • Youtube
  • LinkedIn
  • Facebook
  • Instagram
  • Bluesky

NEWSLETTER

CONTACT

  • Why it matters
    • Why transparency matters
    • Data use examples
    • Research into aid transparency
    • The Story of Aid Transparency
    • What you can do
    • Case studies
  • Aid Index
    • 2024 Index
    • 2022 Index
    • Comparison Chart
    • Methodology
    • Index Archive
    • Tools
    • The Power of the Aid Transparency Index
  • DFI Index
    • DFI Transparency Index 2023
    • DFI Research
    • DFI Transparency Tool
    • FAQs
  • Our Work
    • Women’s Economic Empowerment
    • Localisation
    • Mobilisation
    • Climate Finance
    • UK Aid Transparency
    • Gender Financing
    • Humanitarian Transparency
    • US Foreign Assistance
    • IATI Decipher
    • Webinars
    • Work Under Development
  • News
    • Reports
    • News
    • Events
    • Blog
  • About Us
    • Board
    • Team
    • Our transparency
    • Our Funders
    • Jobs
    • Annual Reports
    • Friends of…
    • FAQs
  • Training
Show Search
Hide Search
Home / News / USAID’s measurement approach is undermining its progress on localization and its goal to diversify its local partner base
news

USAID’s measurement approach is undermining its progress on localization and its goal to diversify its local partner base

By Sally Paxton and Henry Lewis | Jun 20, 2024 | Blog, News

The US Agency for International Development (USAID) has made a bold commitment to the localization agenda: it has set a target that 25% of its funding will go directly to local partners by 2025. We congratulate USAID for its ambitious goal and for showing leadership in this area. However, new Publish What You Fund analysis shows that how USAID defines and measures localization is actually undermining its progress and at odds with its aim to increase the diversity of local partners and amplify under-represented voices. It is allowing perverse incentives – such as affiliates of international organizations to be counted as local – and leaving significant funding opportunities – such as projectized funding that currently goes to UN agencies and multilaterals – untapped for local partners.

The chart shows two lines comparing the percentage of USAID funding directed to local organizations in 10 countries using two different approaches – the Publish What You Fund approach and the USAID approach – across five US fiscal years from 2019 to 2023. Using the Publish What You Fund approach, it shows that there has been a drop in the percentage of USAID funding directed to local organizations over the 5-year period. It shows in 2019 that 7.6% of funds went directly to local organizations, in 2020 it was also 7.6%, in 2021 it dropped to 5.6%, rising slightly in 2022 to 6.1%, and then dropping again in 2023 to 5.2%. Using the USAID approach, it shows that the figures are higher than the Publish What You Fund approach but there has also been a drop in the percentage of USAID funding directed to local organizations over the 5-year period. It shows in 2019 that 12.3% of funds went directly to local organizations, in 2020 it dropped slightly to 12.0%, in 2021 it dropped again to 9.1%, rising in 2022 to 10.6%, and then dropping slightly again in 2023 to 10.3%.

As we approach USAID’s deadline for reaching its 25% local funding goal, Publish What You Fund is calling on USAID to commit to reviewing its approach to measuring localization in 2025. We are highlighting two priorities:

  • 25% of funding should mean 25% of ALL project funding. USAID excludes billions of dollars from consideration for its localization target – chiefly money going to UN projects. This accounted for $1.5 billion in the 10 countries we analyzed. These funds provide a huge opportunity for directing more funding to local organizations.

Comparison of USAID and PWYF denominators. There are two pie charts comparing the USAID and Publish What You Fund denominators, calculated using different approaches, across 10 countries for US fiscal year 2023. In the Publish What You Fund pie chart on the left, using the Publish What You Fund approach to calculate the denominator, there is a smaller pie section showing that $1.2billion was excluded from funding flows that USAID uses to calculate its 25% target. The larger pie section shows a figure of $4.2 billion that makes up the Publish What You Fund denominator. An arrow flows down from the Publish What You Fund pie chart to a stacked bar chart showing how much of the denominator is directed to local and non-local organizations. The larger bar section shows that $4.0 billion of funding is directed to non-local organizations while the small bar section shows hat $221 million is directed to local organizations. In the USAID pie chart on the right, using the USAID approach to calculating the denominator, there is a larger pie section showing that $3.1 billion was excluded from funding flows that USAID uses to calculate its 25% target. The smaller pie section shows a figure of $2.4 billion that makes up the USAID denominator. An arrow flows down from the USAID pie chart to a stacked bar chart showing how much of the denominator is directed to local and non-local organizations. The larger bar section shows that $2.2 billion of funding is directed to non-local organizations while the small bar section shows that $247 million is directed to local organizations.

  • USAID’s definition of “local” allows the local offices of international organizations to be counted as local. This sets perverse incentives and is at odds with USAID’s desire to expand the diversity of local actors and amplify local voices.

The analysis is contained in our Metrics Matter II report. Publish What You Fund has undertaken detailed research into USAID’s local partner funding goal to establish an independent, credible, and replicable measurement approach to track funding for local partners, as well as evaluate USAID’s progress in directly funding local organizations and assess the suitability of USAID’s measurement approach to achieve its stated goals.

Metrics Matter II builds on the methodology established in our 2023 Metrics Matter I report. We have examined USAID funding in 10 sample countries (Bangladesh, Ethiopia, Guatemala, Haiti, Jordan, Kenya, Liberia, Moldova, Nepal, and Zambia) and compared our own measurement approach with the approach adopted by USAID to determine the difference in funding amounts currently directed to local partners and the amounts that would be needed to reach the 25% target.

The outcome of our analysis illustrates how differences in measurement approaches change the funding amounts USAID will need to provide local organizations to reach the 25% target. It also shows that USAID is a long way from meeting its 25% goal.

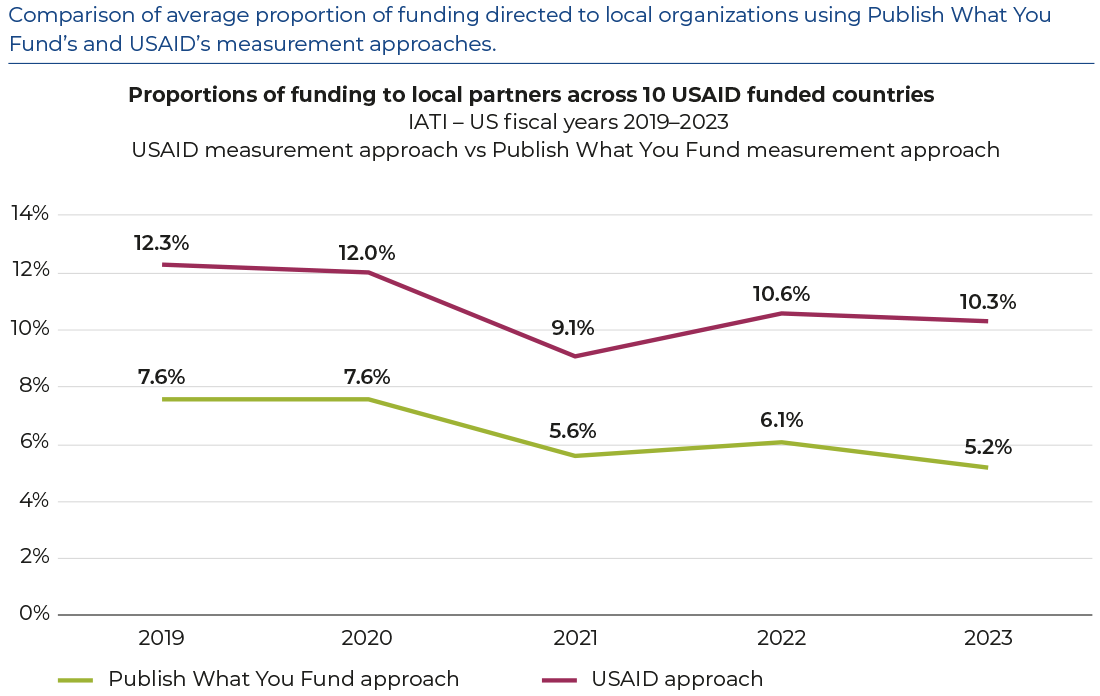
By analyzing funding in US FY 2023 and applying both measurement approaches we found for our 10 countries:

  • USAID’s approach nearly doubles the percentage counted as going directly to local organizations – 10.3% compared to 5.2% using our approach. Both approaches show a drop in the proportion of funding directed to local partners compared to US FY 2022.
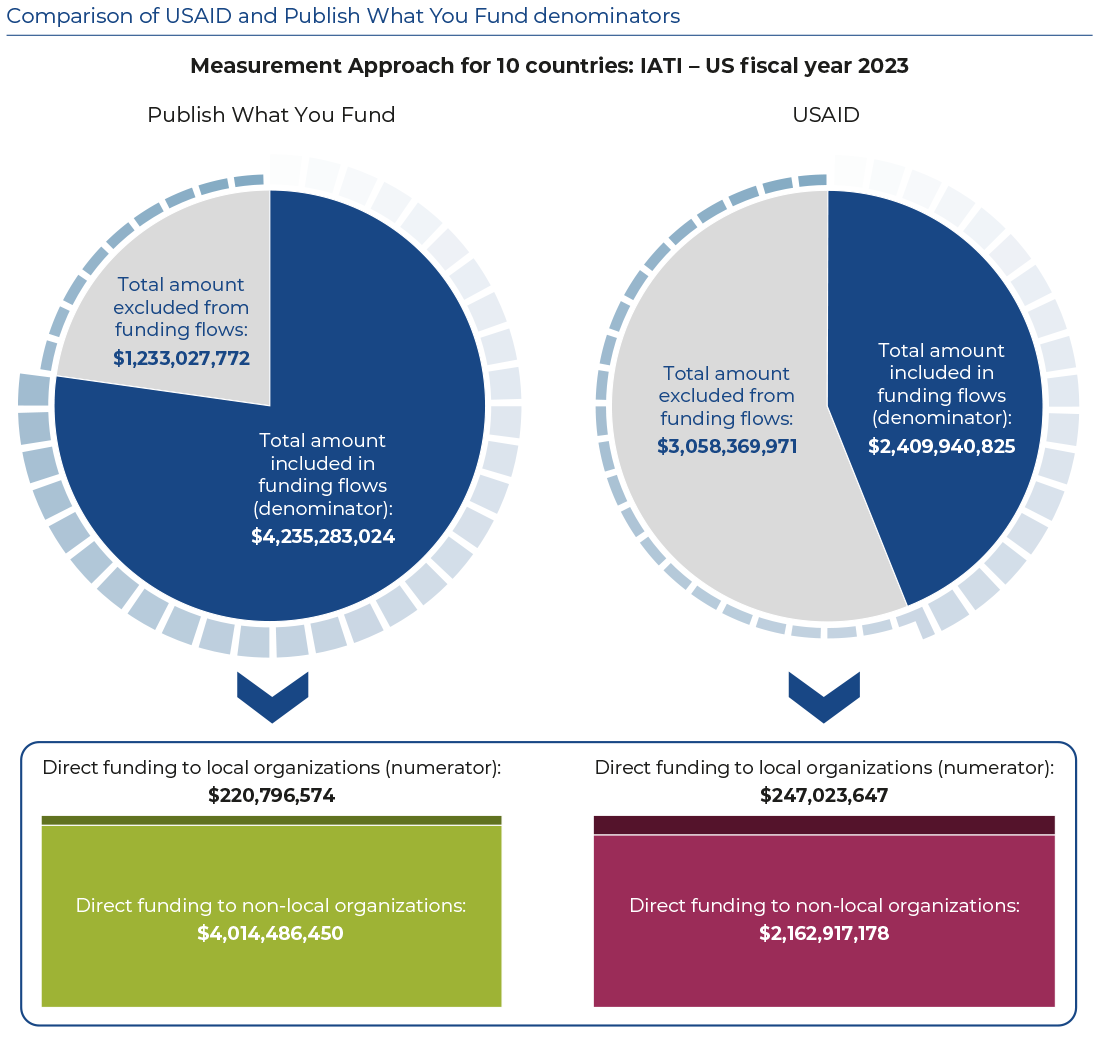
  • USAID’s denominator (the 25% of what) reduces the envelope of funding considered for the 25% target from $4.2bn to $2.4bn when compared to a denominator which provides more opportunities for local organizations.
  • Under USAID’s approach, an estimated $247m went directly to local partners. To reach 25%, USAID would have needed to channel an additional $355m to local organizations in our 10 countries.
  • Using Publish What You Fund’s approach, an estimated $221m went to local partners. To reach 25%, USAID would have needed to fund an additional $840m directly to local organizations in our 10 countries.

Primary Sidebar

NEWS Topics

Africa Agriculture Aid transparency Aid Transparency Index Australia Canada Climate Change Data Revolution Data use Data Visualisation Development Finance institutions DFI Spotlight DFI Transparency Tool European Commission Financing for Development France Freedom of Information Gender Germany Humanitarian Impact International Aid Transparency Initiative Japan Jobs Joined-up data Kenya Letters Localisation MDGs mobilisation Newsletter OECD Open data Open government Press Releases Publish What You Fund Road to 2015 Sustainable Development Goals UK United Nations US USAID Webinar Women's Economic Empowerment World Bank

Twitter (X)

  • Contact Us
  • Copyright
  • Privacy Policy
  • RSS
  • Twitter
  • Vimeo
  • Youtube
  • LinkedIn
  • Facebook
  • Instagram
  • Bluesky

Publish What You Fund. China Works, 100 Black Prince Road, London, SE1 7SJ
UK Company Registration Number 07676886 (England and Wales); Registered Charity Number 1158362 (England and Wales)