


DFI additionality disclosure: More boxes ticked, but is value added?
A year ago, we asked how convincingly development finance institutions (DFIs) could show that their financing added something the private sector would not otherwise have provided. Twelve months and a fresh dataset later, we went back to check their progress.
Overall, the change was a positive one. Digging into the Organisation for Economic Cooperation and Development’s Creditor Reporting System (OECD CRS) data, we found clear progress across the bilateral DFIs examined in terms of completeness and quality of additionality disclosure. Three new institutions also began reporting. However, some weaknesses remain, including blanket additionality type labelling and templated narratives. The priority for future data releases is for DFIs to improve the specificity and quality of their additionality disclosure, so that we can verify their use of scarce public resources. The detailed findings are set out in our new paper: Making additionality count II: Assessing disclosure in private sector instrument reporting.
What is additionality and why is it important?
Additionality, the idea that a DFI intervention leads to effects which would not have occurred without its presence, is foundational to the very existence of DFIs. Without it, DFIs risk distorting markets and financing what would have happened anyway, which is a poor use of public money that may do more harm than good. In 2025, official development assistance (ODA) budgets fell 23 percent in real terms, the largest annual contraction on record.[1] It is therefore more important than ever that scarce resources are deployed as efficiently and impactfully as possible.
Despite the importance of this concept, there have historically been good reasons to be sceptical about the true additionality of DFIs. In 2016, one study bluntly concluded from a series of interviews that there was little evidence of additionality in DFI operations,[2] and since then civil society organisations have repeatedly raised concerns about the lack of transparency on how DFI resources are used and the risk that ODA statistics become inflated by activities that fail to meet development objectives.[3]
One could argue that the lack of evidence on DFI additionality is partly explained by the impossibility of proving that a project would not have proceeded without DFI support. Proving whether specific uses of DFI capital are optimal is inherently complex because this counterfactual is difficult to evidence.[4] However, in the absence of being able to prove additionality outright, the presence of a convincing and detailed supporting narrative becomes even more important. This is because project-specific descriptions provide a stronger evidence base for how plausible the counterfactual is, and whether an investment risks crowding out private finance rather than crowding it in.
Transparency on additionality is therefore essential to address these concerns. External stakeholders, including donors, civil society, boards, and shareholders, need DFIs to disclose how they assess and justify the additionality of their investments, so that institutions can be held accountable for whether scarce ODA resources are achieving their intended development impact.
Evolving reporting rules at the OECD’s Development Assistance Committee (OECD-DAC) have recognised this need. DAC members are now required to demonstrate financial and/or value additionality, together with development additionality, of all DFI activities for them to be counted in ODA figures. This latest data release is the last covered by the transitional reporting period, so we took stock of how transparency is progressing before the rules apply in full at the next release, expected later this year.
What we found: More complete additionality data but still concerns over quality
In this update, we examined the most recent OECD-DAC Creditor Reporting System release, focusing on 2024 private sector instrument (PSI) data for a selection of DFIs[5]. We compared this to the last release of 2023 data and found several key shifts:
The OECD has improved the accessibility of PSI and additionality data:
- A new PSI dashboard and data cube. The new dashboard improves the accessibility of high-level PSI data but does not display the granular additionality fields (type codes, description, or development objective).
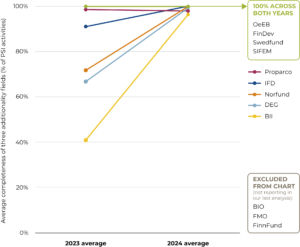
The completeness of additionality data has improved across all DFIs examined:
- New reporters. Belgian Investment Company for Developing countries (BIO), Dutch Entrepreneurial Development Bank (FMO), and Finnfund are now disclosing PSI activities with additionality fields disclosed.
- The share of activities with populated fields has improved. All DFIs examined now have above 90 percent of disclosed activities with complete additionality type, description, and development objective fields.
The quality of additionality data has improved in some areas, but some concerns remain:
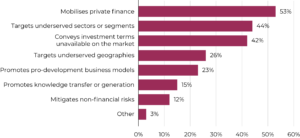
- Most DFIs now apply a spread of additionality types across their activities. However, some DFIs still rely disproportionately on specific additionality types. Such blanket labelling might indicate that a DFI lacks the investment-specific processes needed to establish additionality.
- Financial additionality types remain the most frequently used labels. The concern is greatest where DFIs default to generic financial labels without also demonstrating the development additionality of their investments with detailed statements.
- Additionality type descriptions have broadly improved. Many DFIs examined have strengthened this field in some form, through longer entries, better coverage, repurposing the field away from restating the type code, or moving towards investment-specific narratives.
- Templating remains a pattern. Although several DFIs have started disclosing more detailed additionality descriptions and development objectives, some are still using templated statements, defeating the purpose of additionality fields.
What still needs to change: Fixing the additionality data gaps
Overall, coverage has increased across almost all the institutions examined, three additional DFIs have begun reporting, and the OECD’s new dashboard and data cube have improved access to PSI data. The persistent weakness lies in the quality and specificity of disclosure, which has improved for some institutions but remained poor at others.
If disclosure continues to rely predominantly on generic codes and templated narratives once the transitional period has concluded, reported ODA counted as PSIs may continue to expand without the transparency required to hold institutions accountable for the additionality of that financing.
We encourage DAC members and their DFIs to:
- Close the last completeness gaps and reach full coverage;
- classify each investment on its own merits rather than applying the same labels across the board;
- replace templated statements with activity-specific narratives;
- use the additionality fields as intended;
- and follow the clearest models of good practice.
Download the new paper: Making additionality count II: Assessing disclosure in private sector instrument reporting
Read a summary of our 2025 analysis
Notes
[1] Preliminary 2025 ODA data: https://www.oecd.org/en/data/insights/data-explainers/2026/04/a-historic-decline-in-foreign-aid-preliminary-2025-oda-data.html
[2] Koenig et al. (2016). Evaluation Study: Private Capital for Sustainable Development: Concepts, Issues and Options for Engagement in Impact Investing and Innovative Finance. Available at: https://etjackson.com/wp-content/uploads/2019/05/2016_Private_Capital_for_Sustain_Development.pdf.
[3] Donor Tracker (2025). Innovative financing series: How DFIs are transforming ODA for sustainable development. Available at: https://donortracker.org/publications/innovative-financing-series-dfis-transforming-oda-sustainable-development#what-is-initial-data-revealing; ODA Reform. Private Sector Instruments. Available at: https://www.odareform.org/private-sector-instruments; Eurodad (2023). Aid under threat: The shadowy business of private sector instruments. Available at: https://www.eurodad.org/aid_under_threat
[4] Kenny, C. & Moss, T. (2020). What to Do When You Can’t Prove DFI Additionality. Available at: https://www.cgdev.org/sites/default/files/Moss-Kenny-DFI-Additionality-Full.pdf
[5] DFIs included: Austrian Development Bank (OeEB) (Austria); British International Investment (BII) (United Kingdom); FinDev Canada (Canada); German Investment and Development Corporation (DEG) (Germany); Impact Fund Denmark (Denmark); Norfund (Norway); Proparco (France); Swedfund (Sweden); Swiss Investment Fund for Emerging Markets (SIFEM) (Switzerland). Excluded: Belgian Investment Company for Developing countries (BIO) (Belgium); Dutch Entrepreneurial Development Bank (FMO) (Netherlands); and Finnfund (Finland)
[6] Filtered only for activities with 2024 commitments dates, as well as the following PSI flags: instrument approach – individual activities counted in ODA (20, 21 or 22) and institutional approach – individual activities for memorandum (40, 41, 42). An activity is defined here as a row with a unique project title, start date, completion date, and commitment date. The percentages are derived from activity counts rather than activity volume.