


Understanding the new MDB methodology on mobilisation – what’s changed and what are the implications?
The MDB Task Force on Mobilization’s long-awaited Joint Methodologies for Measuring Private Finance for Development are the first update to how MDBs measure private capital mobilisation (PCM) since 2018. The new package is far more detailed and much broader in scope. It captures innovations such as risk transfers and securitisations through a new “portfolio private direct mobilisation” category, alongside measures of private finance generated before MDB projects and catalysed after them, many of which echo Publish What You Fund’s own proposals. While the MDB Task Force is equivocal about the overall effect, the new categories are likely to push reported mobilisation up, raising the question of whether existing targets should be revisited so that progress reflects a transformed business model rather than a change in counting. Despite welcome collaboration with the OECD, the two approaches still attribute mobilisation differently and are best treated as distinct measures. Above all, the package says remarkably little about transparency, and without granular, investment-level disclosure it will be hard for stakeholders to understand why figures change, learn what works, scale it, or show other market participants where the opportunities lie.
The new MDB Joint Methodology
The much anticipated MDB Joint Methodologies for Measuring Private Finance for Development (hereafter Joint Methodology) were released by the Multilateral Development Bank Task Force on Mobilization (hereafter MDB Task Force) last week. While now encompassing more than just private capital mobilisation (PCM), the Joint Methodology represents the first update to the MDB Task Force’s approach to measuring PCM since 2018. This development has not happened in a vacuum. Calls for MDBs to do more with their capital, including shifting towards an originate-to-distribute business model have influenced the types of activities that MDBs are pursuing (for more, see our recent blog on MDB securitisations). Concurrently, organisations – including Publish What You Fund – have been advocating for improvements to both the measurement of PCM and the transparency of PCM data. Finally, the revisions to the MDB Joint Methodology are occurring alongside similar revisions to the OECD approach to measuring PCM. This blog unpacks the new Joint Methodology, situating it within the developments mentioned above. Following this, it seeks to understand the implications of the updated methodology for tracking and understanding PCM.
What’s changed in the Joint Methodology?
The first and arguably clearest change between the new Joint Methodology and the one it replaces is the level of detail and instruction that it provides. The previous methodology was a 17 page “reference guide” that defined PCM and its constituent parts and provided high level guidance on calculating and attributing PCM. The new Joint Methodology – or rather, methodologies – is a package of four documents including an overview on the concept of PCM and the history of its measurement, a guide to calculating mobilisation, a guide to calculating generation, and a progress update on the development of a guide to calculating private capital catalysation, totalling over 90 pages of guidance. In short, there is a lot to digest.
The expanded guidance is explained by two things. First, the level of detail including qualification of projects and instrument-specific definitions and rules have increased greatly. This is a welcome innovation; the old Joint Methodology was high level to the extent that it created the risk of misinterpretation by reporting institutions. The new guidance should go a long way to addressing that concern. Second, and as will be discussed in more detail below, the new Joint Method simply covers a far larger segment of MDB and associated private financial activities.
In essence, the new Joint Methodology has moved beyond an approach to calculating PCM occurring at the level of individual investments – as was the case in the old methodology – towards a measure of the total financing for development caused by MDB activity. The timeframes in which private financing is measured have been expanded to include both private investment before MDB projects (generation) and after projects (catalysation). During the timeframe of MDB projects, the concept of mobilisation has been expanded to include new categories (transactional private direct mobilisation and portfolio private direct mobilisation). Each of these concepts is unpacked in more detail below. A schema of the new Joint Methodology is given in Figure 1, below.
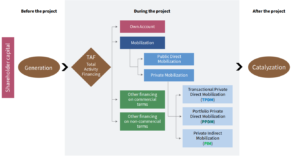
The old Joint Methodology measured only PCM that occurred during an MDB project or investment. This mobilisation was calculated through three concepts – total private mobilisation, private direct mobilisation, and private indirect mobilisation.[1] The new Joint Methodology identifies two constituent parts of mobilisation: public direct mobilisation and private mobilisation, the latter of which is split into three further parts: transactional private direct mobilisation, portfolio private direct mobilisation, and private indirect mobilisation. Broadly, transactional private direct mobilisation is analogous to the prior methodology’s private direct mobilisation, while private indirect mobilisation has been carried over from the prior methodology.[2] As such, the most notable alteration to the methodology for measuring PCM is the introduction of portfolio private direct mobilisation. This category involves mobilisation that occurs when an MDB transfers credit risk from its own portfolio to private investors. This may occur through the sale of equity or debt, reinsurance, or through significant risk transfers, including securitisations. This category is broadly analogous with the “basket” of mobilisation that Publish What You Fund called “secondary private capital mobilisation” in previous recommendations. This is significant as the activities included under portfolio private direct mobilisation are consistent with the activities MDBs are expected to increasingly undertake as they orient from originate-to-hold to originate-to-distribute business models and recycle capital quicker.
As noted above, the new Joint Methodology also includes a measure of private investment that occurs before MDB projects called “generation”. Simply, this covers private investment that is predicated on the MDB’s credit rating and is capital that is ultimately repaid by the MDB. This includes capital raised through capital markets, including bonds issued by the MDB (including general, special purpose, and outcome bonds), hybrid capital and equity, and non-capital market products including carbon credit forwarding, carbon credit market development, reinsurance and guarantees issued to the MDB, and future products. This measure is broadly analogous to Publish What You Fund’s proposal of “balance sheet operations” in previous work.
The new Joint Methodology will also ultimately include a measure of private capital catalysation, although this element of the methodology is currently incomplete. Private capital catalysation is conceived of as finance made available by private investors because of MDB activity, but outside of MDB own investment or PCM. Therefore, this broadly covers downstream private investment that was made possible by a prior MDB investment. Publish What You Fund proposed a similar concept (“catalysation”), while it remains similar in principle to the World Bank’s concept of “private capital enabled” that is included as an indicator in the World Bank Group Scorecard.
What’s stayed the same in the Joint Methodology?
Despite the significant alterations to the Joint Methodology as described above, much also remains the same. Fundamentally, the Joint Methodology’s understanding of how PCM occurs remains unchanged – PCM occurs as the result of MDB investment or advisory activities. In this conceptualisation of PCM, the role of explicitly concessional capital – often provided by public or philanthropic donors – is not recognised. For example, in investments made through the Canada-IFC Blended Climate Finance Program, the Canadian Government provides concessional capital blended alongside IFC investment. Any PCM occurring as a result of that investment would be solely credited to IFC. Indeed, the Joint Methodology does not recognise the mobilising contribution of any public investment outside of the members of the MDB Task Force.
Convergence or divergence from the OECD approach?
Much has been made in recent years of the need for greater alignment between the MDB and OECD approaches to measuring PCM. Some of the impetus for greater alignment has come from reporting institutions – particularly bilateral DFIs – that are burdened with dual reporting and the associated resource costs, while other stakeholders including policy analysts have criticised the confusion caused by the existence of competing data for what are generally the same set of development activities.
As noted earlier, the update to the Joint Methodology has taken place concurrently with methodological updates to the OECD approach. Both parties have in fact worked closely during the development of these updates to minimise divergence and this is to be welcomed. Both the OECD approach and the Joint Methodology cover generation, portfolio mobilisation, and catalysation. The OECD is also trialling data collection on “second-level flows mobilised through collective investment vehicles (CIVs)” which is conceptually similar to the guidance that the new Joint Methodology provides on “Intermediated Mobilization”. In both cases, this involves mobilisation that occurs at the level of sub-investees after an initial investment has been made into a CIV or platform.
However, despite the apparent similarities in the developments of the OECD approach and the Joint Methodology, one should be cautious about assuming that significant convergence between the approaches has taken place. The fundamental assumptions that underpin each approach remain different and, as such, the resulting attribution of PCM is distinct. While, as noted above, the Joint Methodology places emphasis on the role of MDBs in arranging and participating in investments (at the expense of other public providers of finance), the OECD approach attributes PCM according to the credit risk that public investors (including MDBs and DFIs) assume. Returning to the example of the Canada-IFC Blended Climate Finance Program, in investments where PCM was generated the OECD would attribute the majority of PCM to the Canadian Government as the provider of the riskiest (concessional) tranche of capital in the investment.
While this key difference remains, it is best to treat the two approaches to calculating PCM as distinct undertaking with differing objectives. The OECD approach seeks to understand the role that all public investors play in mobilising capital, with an assumption that riskier capital is more mobilising, while the Joint Approach is best understood as a measure of the effectiveness of MDBs and DFIs in bringing private investment into projects, including through the deployment of third party concessional capital.
Implications of Joint Methodology for reported PCM volumes
The update to the Joint Methodology has occurred in a context where MDBs are being simultaneously asked to mobilise more private finance and to do more with their own capital. The Triple Agenda report of the Independent Expert Group (IEG) called on the international development finance system to mobilise and catalyse $500 billion a year by 2030, while the G20 Capital Adequacy Framework Report called on MDBs to free up investment capital by shifting loan risk to counterparties. It is therefore unsurprising that the new Joint Methodology includes new categories of PCM that will likely contribute to larger reported volumes and covers a range of instruments that lend themselves to an originate-to-distribute business model.
In a recent call with civil society, the MDB Task Force was equivocal about the expected impact that the updated Joint Methodology will have on reported PCM figures. On the one hand, the inclusion of a new category of mobilisation in the form of portfolio private direct mobilisation and the addition of new or expanded guidance on instruments such as hedging, guarantees and risk transfers will inevitably push figures up. On the other hand, the MDB Task Force argues that stricter definitions and principles – including around definition of a project – and changes to guidance around credit lines and advisory services amongst other instruments, will reduce figures elsewhere.
It could be argued that we should not be overly worried about reported PCM volumes increasing because of changes to the Joint Methodology. Ultimately, if we conceptually accept that the newly included instruments mobilise private capital, they should be counted regardless of whether it results in higher reported volumes. Having said that, it is arguably worth revisiting previous mobilisation targets as, if these were based on an expectation of changing business models as opposed to a changed methodology, then they may warrant revising upwards. Simply, it was surely not the intention of the IEG that the $500 billion annual PCM target would be achieved with “business as usual” through a new methodology, as opposed to a transformed business model.
Implications of the new Joint Methodology for transparency
The new Joint Methodology package says remarkably little about PCM data transparency. The guidance indicates that the new categories – including generation, catalysation, portfolio private direct mobilisation – will be reported as separate indicators, although it is broadly unclear how disaggregated these indicators will be. This is in line with prior recommendations from Publish What You Fund that different “baskets” of mobilisation should not be aggregated so double counted can be avoided. The only specific information regarding disaggregation relates to generation which will not even be disaggregated by institution. This is a particularly confounding decision as one may expect the joint report to provide some indication of comparative institutional performance, yet this level of aggregation will make such analysis impossible. The supposed utility of reporting generation as an indicator is largely undermined through reporting it as a single metric across institutions.
Previous MDB Joint Reports do not offer much reason for optimism that the transparency of PCM data will improve. In June we assessed the 2024 Joint Report and scored it 0 out of 3 for transparency. Regardless of whether reported PCM volumes increase or decrease, granular transparency is imperative for stakeholders to understand the reasons behind these dynamics. Given the significantly expanded scope of the Joint Methodology, this requirement is greater than ever.
Why does this matter? As Publish What You Fund argued in Crowding In, better measurement of mobilisation is only the first step; without disaggregated disclosure, its benefits will be marginal. Not all mobilised capital is equal. The risk private investors take varies dramatically between instruments and contexts, and aggregated figures make it impossible to distinguish mobilisation caused by a guarantee from that caused by a syndicated loan, or to spot outliers: a single investment once accounted for more than 90% of one MDB’s reported mobilisation in a year. Granular data is how institutions and their shareholders learn what works, where and with which instruments, and so how successful approaches can be scaled. It is also essential for governance, allowing shareholders to benchmark institutions, judge whether scarce concessional capital is being used efficiently, and test whether MDBs are crowding private investors in rather than out. Finally, it matters for the market itself. Investors considering emerging markets need to see where and how others have invested alongside MDBs, and investment-level disclosure that identifies co-investors by type rather than by name, an approach private investors have told us they are comfortable with, would provide exactly that demonstration effect.
Granular reporting of PCM data is possible. In recent years significant strides have been made by a handful of multilateral MDBs – including the Development Bank of Latin America and the Caribbean (CAF) and IDB Invest – and some bilateral DFIs in reporting investment level PCM data. Over the last two years the OECD has published granular PCM data for multiple bilateral DFIs indicating that publication is achievable. While a lack of transparency through the joint reporting of the MDB Task Force does not preclude disclosure by individual institutions, the creation and maintenance of a purpose-built dataset behind the Joint Reports represents the ideal scenario, offering stakeholders a single source of comparable data across institutions.
Notes
[1] Total private mobilisation was calculated as the sum of private direct mobilisation and private indirect mobilisation.
[2] Each concept has been broadened through the introduction of newly qualifying activities such as hedging.